The top line
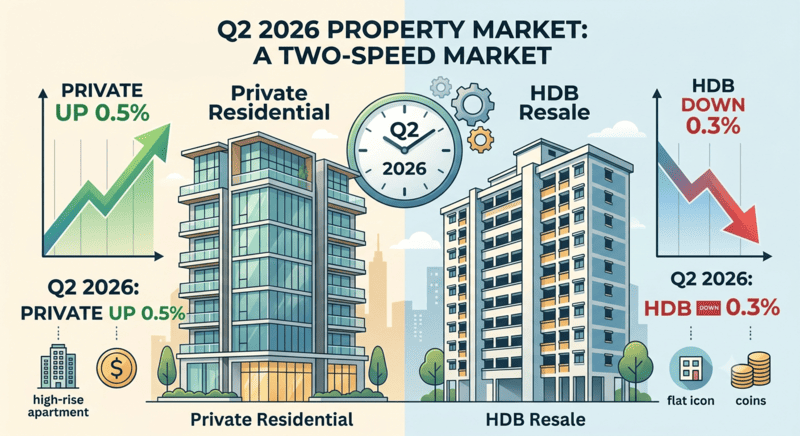
URA's private residential property price index rose 0.5% quarter-on-quarter in Q2 2026, easing from 0.9% in Q1. That brings first-half growth to 1.4% — the slowest first half since 2020.
HDB's Resale Price Index fell 0.3% in Q2, following a 0.1% dip in Q1. Cumulative first-half movement: -0.4%. Set that against +0.3% in 2H 2025 and +2.5% in 1H 2025.
Two indices, two directions. But averages hide the real story.
Inside the private index, four different markets
Landed: +2.6% QOQ. After a 0.4% decline in Q1, landed homes led the quarter, taking cumulative 1H growth to roughly 2.1%. Transaction volume was broadly stable — 491 to 568 deals depending on the caveat cut-off. Average unit price on land area rose across detached, semi-detached and terrace, in a band of roughly 3.3% to 5.9% QOQ.
CCR non-landed: +1.8% to +2.0% QOQ. The prime region outperformed with no new launches in the quarter. That is worth pausing on. Price growth without launch activity means the index was lifted by transactions at existing projects and a modest number of high-end sales. Thinner data, genuine strength — but read it with care.
RCR: down roughly 1.2% to 1.4% QOQ. Largely attributable to realistic pricing at Hudson Place Residences, which sold 218 units at a median $2,467 psf — about 2% below the median achieved at the preceding Media Circle launch.
OCR: down roughly 0.1% to 0.2% QOQ, after a 2.2% rise in Q1. The driver here is compositional. Tengah Garden Residences, the first private condo launch in Tengah, moved 853 of 863 units — 99% — over its launch weekend at an average $2,120 psf. When one project at an accessible price point dominates a quarter's OCR caveats, it pulls the index down. That is not the same as OCR values falling.
The lesson: a negative index in a region does not mean your unit in that region is worth less. It means the mix of what transacted changed. Always separate index movement from asset movement.
Inside the HDB index, the same split
Resale volume was 6,268 transactions in Q2, effectively flat against 6,285 in Q1 but roughly 10% below the year-ago quarter. Buyers are still transacting — they are just more selective and more price-sensitive.
And then the divergence: 491 flats sold at $1 million or above in Q2 2026 — a record quarter, surpassing the previous high of 480 set in Q3 2025. That is 19.5% above Q1's 411 and 18.3% above Q2 2025's 415. Million-dollar deals made up 7.7% of all resale transactions, up from 6.5% in Q1 — the highest share on record.
Breakdown: 212 four-room, 183 five-room, 93 executive, two three-room, one multi-generation. The Central Area, Queenstown and Toa Payoh all recorded million-dollar median resale prices in the four-room category.
An index falling while its top segment sets records is not a contradiction. It is a market where location and attributes are being priced with increasing precision.
What is driving the moderation
Supply. Around 13,500 flats reach MOP in 2026, rising to roughly 15,000 in 2027 and 19,500 in 2028. HDB launches close to 7,960 BTO flats in October 2026 across Bedok, Geylang, Sembawang, Tengah, Toa Payoh and Yishun, plus a Community Care Apartment project in Toa Payoh.
On the private side, 4,745 units come to market under the 2H 2026 Confirmed List, bringing full-year Confirmed List supply to 9,320 units — over 50% above the past ten-year annual average. Around 61,000 private units including ECs are expected to complete over the next few years.
This is a supply-led moderation, not a demand collapse. New private home sales actually rose 5.1% QOQ to 2,116 units in Q2, despite fewer launches.
What this means for your position
If you are selling: the index is not your comparable. Your comparable is the last three transactions in your block, adjusted for facing, layout, and condition. In a market pulling apart at both ends, the gap between a well-positioned unit and an averagely-marketed one widens. This is precisely the market where positioning earns its keep.
If you are buying: you have more options than you had twelve months ago and more negotiating room in the middle of the market. You have less at the top. If your target is a well-located, newer, larger unit, do not assume a softening index gives you leverage — in that segment it does not.
If you are upgrading: the sequencing question matters more than the price question. HDB softening while private holds means your sale side is under more pressure than your buy side. Model the gap properly before you commit to an OTP.
Index numbers are a starting point, not an answer. If you want to know what your specific unit is worth in this market — facing, layout, condition, and the last comparable transactions — I'll run the numbers and show you the working. No obligations.
Eric Lee · TheMarketPlace, PropNex Realty
Your Preferred Real Estate Partner
